The Integrated Development Environment JControl/IDE
IV. The Simulator
The Simulator integrated into the JControl/IDE allows the user to test his own projects in a sophisticated way without the need for a physical device. Since version 3.3 the JControl/IDE has been upgraded with a brand new integrated simulation environment (JControl/ISE).
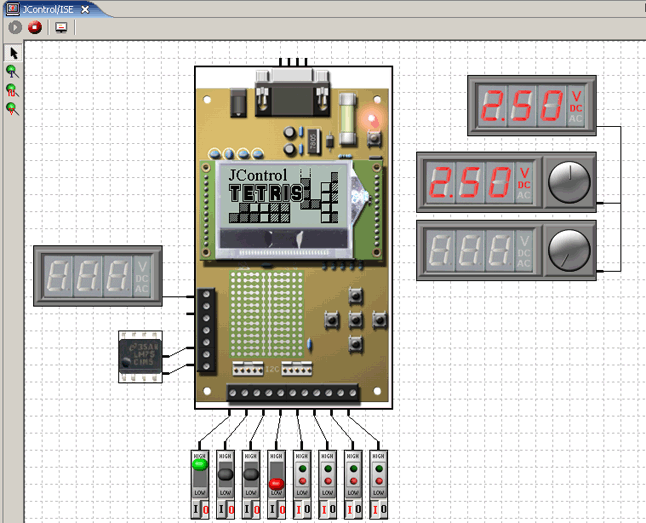
Beside the fact that the simulator from now on no longer runs in an external window but directly inside the IDE, some great new features have been implemented:
- Different simulation environments: Each project may have its own simulation environment, depending on the demands of the project.
- Simulated signal flow: Now it's possible to simulate and visualize signal flow from and to the device's input and output connectors.
- Extended simulated components: Additionally to the main JContol device, even components connected to the device, such as termometers, voltmeters, digital I/O components, voltage supply etc. can be simulated.
In this chapter you will learn more about using the new integrated simulation environment.
Starting the Simulator
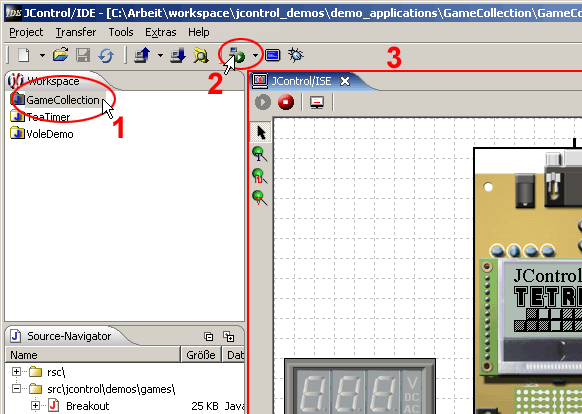
To start the simulator, select the project simulate in the workspace (fig. 1.1). Open the simulator by clicking the simulation icon (fig. 1.2) in the toolbar. The simulator appears in the editor panel showing a default simulation environment (fig. 1.3).
Choose a Simulation Environment
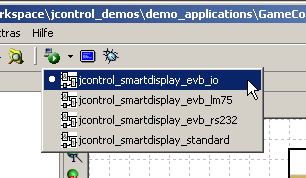
An important new feature of the simulator is the ability to choose between different simulation environments. Depending on the IDE distribution this choice may differ significantly from the example in this tutorial. Different simulation environments are equipped with different kinds of external components. Possible components are, e.g., termometers, connected RS232 communication devices etc.
By opening the submenu of the simulator tool in the toolbar you will see all available simulation environments. Selecting one of the menu items will open the Simulator with the desired configuration. Please keep in mind that the choice of available environments even depends on the device selected for the current project.
Monitoring the I/O Ports
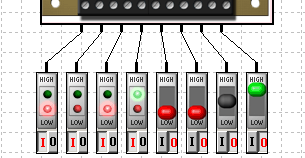
The IO-ports can be monitored and controlled via connected external components, e.g. digital I/O-components shown in figure 3. These components have two different modes. They can be used as active switches supporting HIGH, LOW and in certain configurations even high impedance values. The second mode is only passive. Here, the components are working as indicators showing the state of a channel by different LEDs.
Monitoring any ports or connections in the simulation is possible by using probes. A probe is a display component that can be attached to a connection or a port. Three different kinds of probes can be chosen using the menu bar on the left.

If you would like to set a probe select the desired menu item. Then, click on the connection or port you want to attach the probe to. A small window will appear showing the correspoding probe component. The following figures show some examples for different probes.

The Text-Probe is used to display the state in a textual way. The display depends on the type of the port (digital, analog, etc).
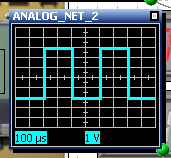
The Scope-Probe represents an oscilloscope. It should be used for frequently changing analog or pulsed signals.

The Voltage-Probe is a simulated digital voltage meter. It displays the current voltage of the port it is attached to.
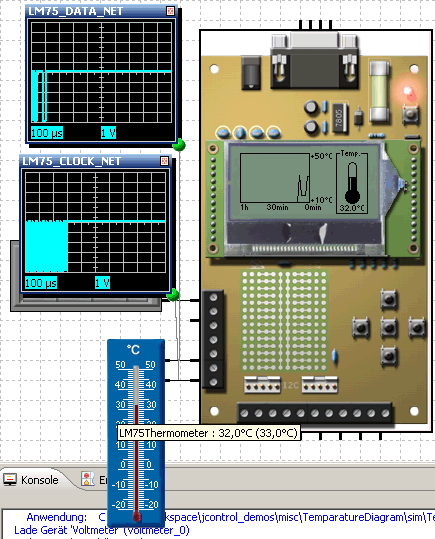
The example shows a simulation environment with an LM75 temperature sensor conntected to the I²B bus of a SmartDisplay Evaluation Board. The I²C bus is monitored using two Scope-Probes.
Displaying the Flash Memory Content
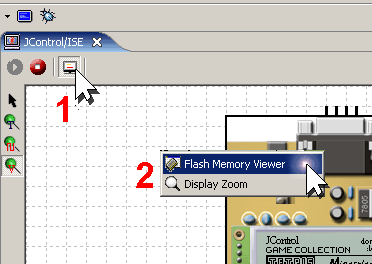
If an application uses the flash memory to store data, the user can verify its flash content by using the flash viewer which is part of the simulator. First, you maybe have to open the console panel (fig. 9, step 1). Then, use the pop-up menu of the JControl device to open the flash viewer (fig. 9, step 2).
The flash viewer shows the current content of the flash memory (fig. 10). Using the the drop-down menus the view can be switched to different sectors or memory banks.

Displaying RS232 Activity
Messages written to the RS232 port by a JControl application can be displayed by the RS232 console (fig. 11).
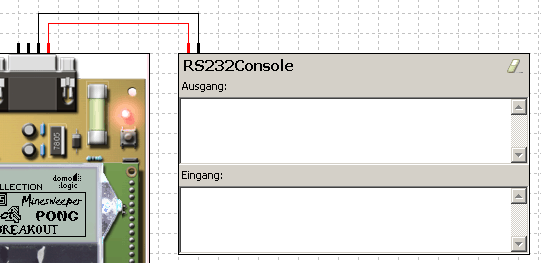
In most simulation environments the RS232 console is already included as a simulation component, e.g. it is always visible in the main simulator window. In all other cases, the RS232 console can be made visible in the same way as the flash viewer.